
Pressure Mapping and Analysis Software
Visualize compatible sensor-array data, record measurement sequences, review changes and prepare analysis outputs within the configured system workflow.
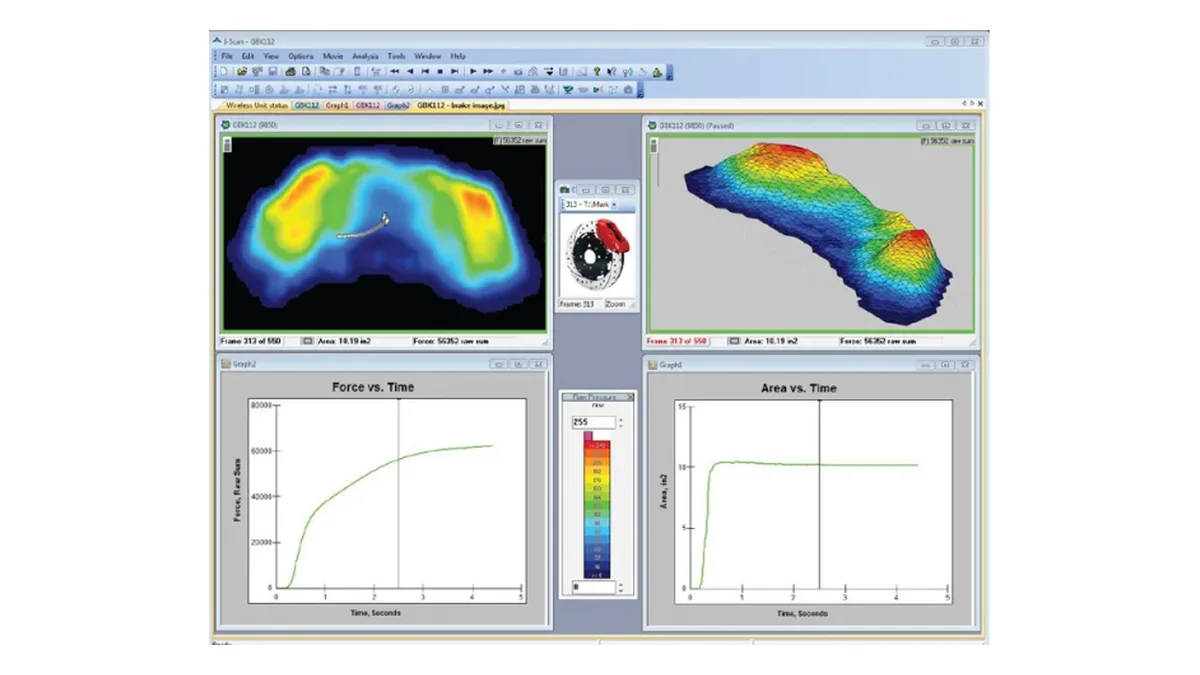
Pressure mapping software turns compatible sensor and reader data into visible, reviewable engineering information. Depending on the confirmed configuration, teams can view 2D and 3D maps, record and replay measurements, compare curves and regions, apply an agreed calibration workflow, and prepare data or report outputs. Available functions, computer environment and licensing are confirmed for the selected system.
See, record, compare and communicate pressure distribution
Available functions depend on the selected acquisition and software configuration.
| Capability group | Engineering use | Configuration note |
|---|---|---|
| Visualization | Review live 2D maps and three-dimensional surfaces | Views depend on compatible sensor and reader data |
| Recording and review | Capture sequences, replay changes and compare test stages | Duration and data handling depend on the configured workflow |
| Measurement analysis | Review pressure, force, area, curves, statistics and center information where supported | Available quantities and calculations must be confirmed |
| Calibration and reporting | Apply the agreed calibration workflow and prepare configured outputs | Workflow and reports are not an accredited certificate |
Functions are matched to the measurement chain
Pressure Mapping and Analysis Software
A configured analysis environment for turning compatible sensor-array data into live and recorded engineering views.
Suitable applications
Engineering visualization, fixture comparison, process review, recorded test analysis and reporting across supported pressure mapping systems.
Complete system components
Compatible thin-film sensor array, matched data acquisition hardware and configured analysis software.
Representative published configuration
The values below describe one representative configuration in this product category. Other sensor, reader and software combinations may use different specifications.
Supported capabilities include 2D and 3D pressure visualization, real-time display, recording and playback, pressure and force analysis, center-of-pressure review, curves, statistics, calibration workflow and reporting outputs.
Available options
Visualization, recording, analysis and output scope selected for the confirmed system workflow.
Confirm for your application
Computer environment, compatible acquisition hardware, required functions, data handling, reporting format, calibration workflow and licensing.
Available specifications depend on the selected sensor, data acquisition hardware and software configuration. Final parameters will be confirmed for the application before quotation.
Useful output starts with a controlled test
Software cannot correct an unsuitable sensor, fixture, loading method or calibration approach. The measurement setup and analysis objective should be defined together.
- InputCompatible sensor and reader data
- ContextFixture and loading conditions
- WorkflowCalibration, recording, analysis
- OutputConfigured views, data and reports
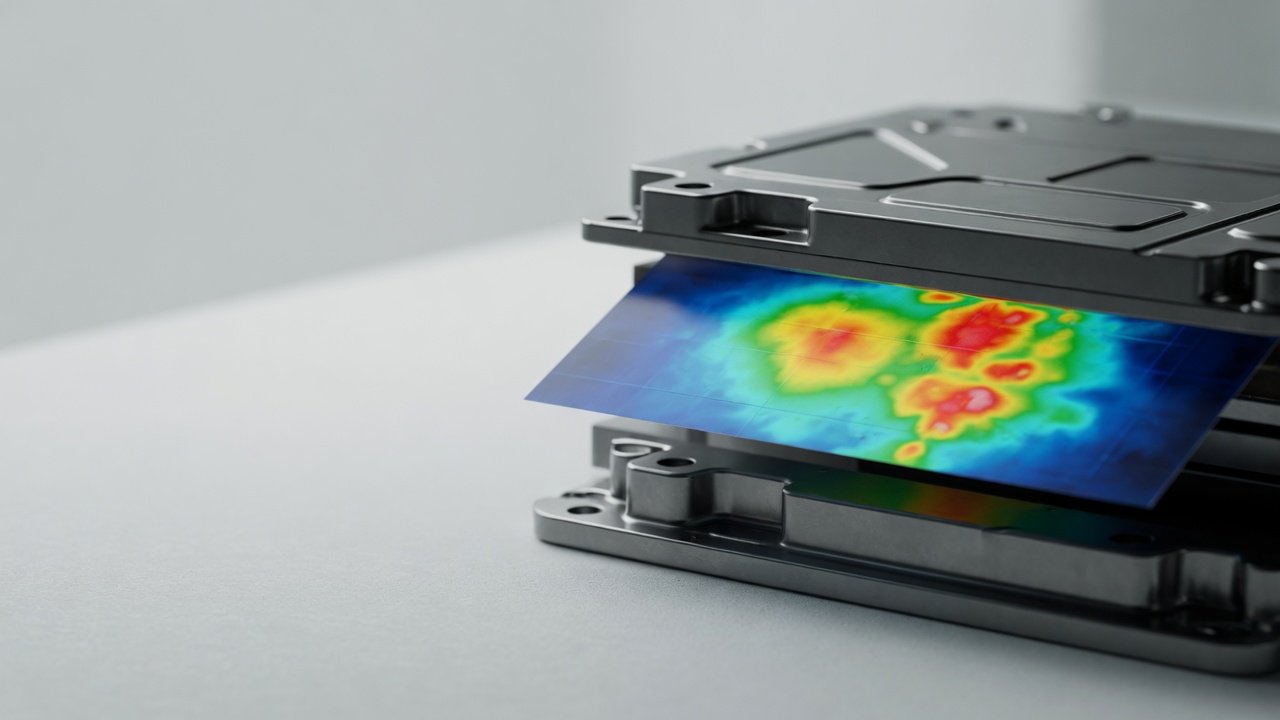
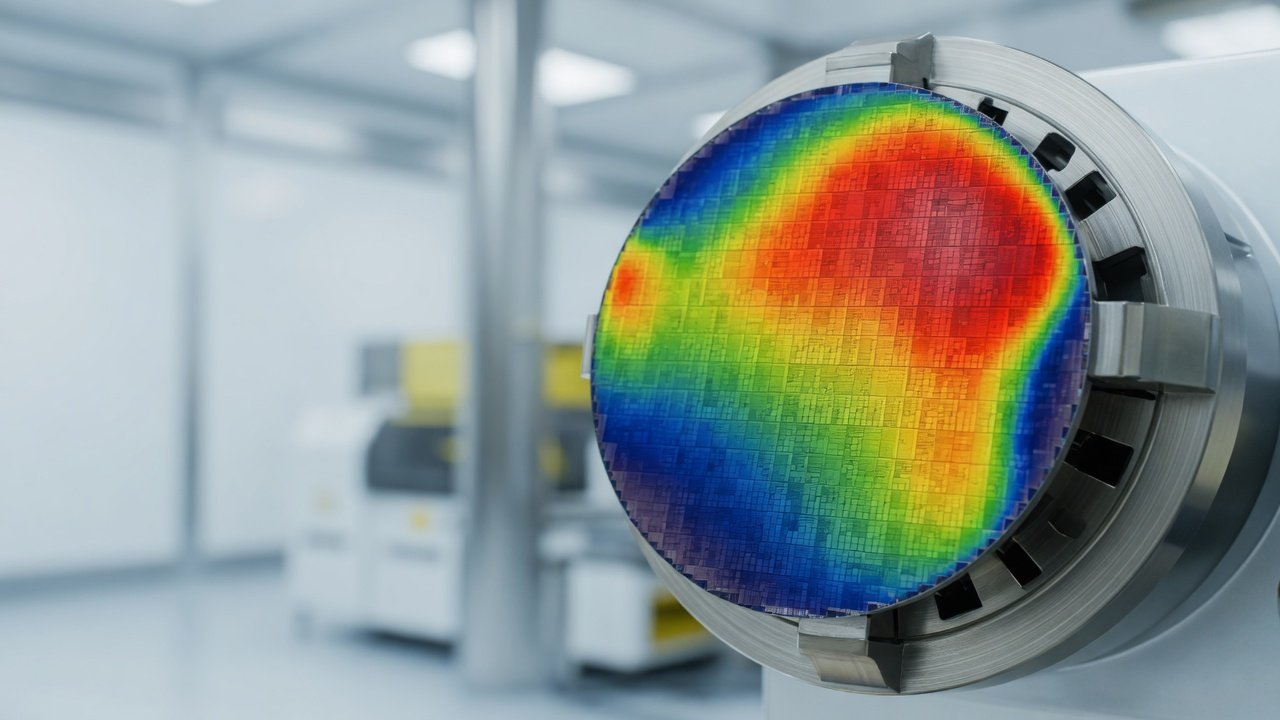
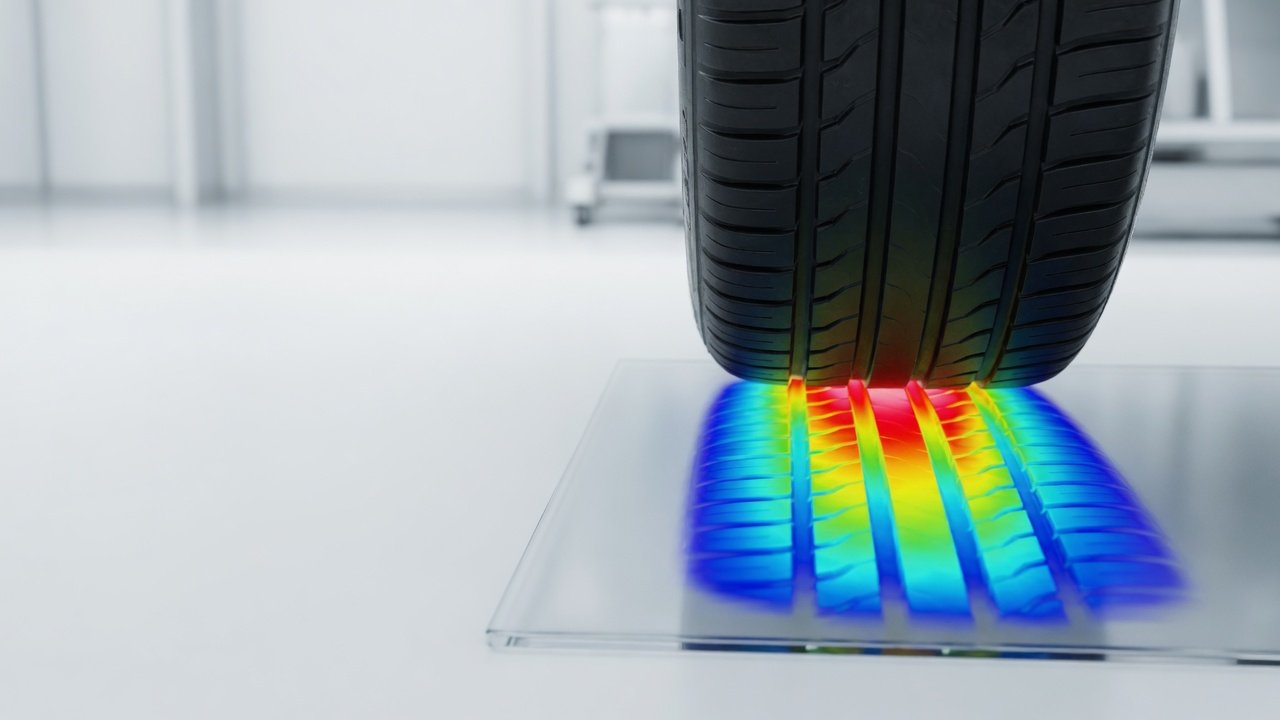
Visualization examples illustrate possible pressure-map outputs; available views and reporting functions depend on the confirmed software configuration.
Apply the analysis workflow to the real interface
Software and analysis questions
What can the software show?
Supported configurations can visualize live and recorded pressure distribution in 2D and 3D views with curves, statistics and reporting outputs.
Is the software supplied separately from the system?
Software is configured as part of a compatible sensor, acquisition hardware and analysis workflow. Final scope is confirmed for the application.
Are operating system, integration and licensing details universal?
No. Software environment, acquisition compatibility, functions and licensing must be confirmed for the selected configuration before quotation.
Define the analysis output before configuring the system
Tell us what the team needs to see, record, compare and report from the pressure mapping test.
Discuss your analysis workflow