Windshield wiper pressure
Measuring pressure along the blade's full length can identify uneven contact under the tested arrangement. Wiping quality, noise, streaking, chatter and lift-off require separate performance evaluation.
From wiper blades to tire footprints — measure and visualize contact pressure across automotive components with reusable film sensors and real-time 2D & 3D maps.
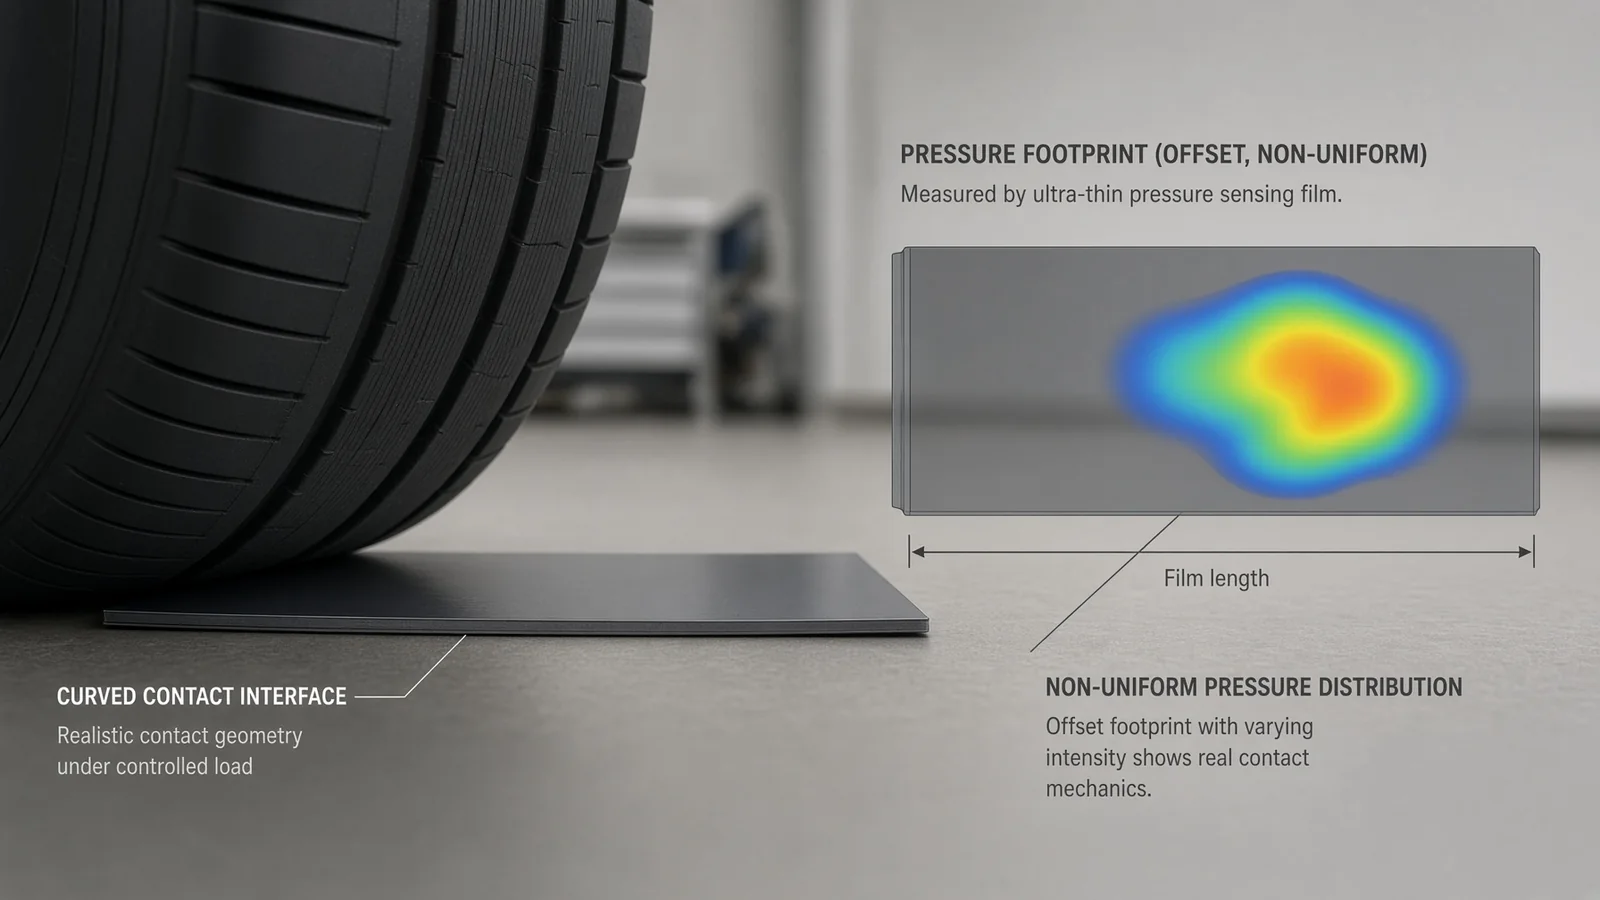
Automotive pressure mapping visualizes contact distribution across a defined component interface. It can support controlled comparison of tire footprints, wiper contact, seals, seating and assembled parts when the sensor placement and test condition are suitable. Teams should define the surface geometry, static or dynamic event, load, duration, environment and required map or data output before selection.
Across the vehicle, pressure mapping can make the tested contact distribution visible and measurable. The map supports engineering comparison but does not by itself establish component or vehicle performance.
Principles above are based on published automotive testing literature; PressMapper does not claim specific performance figures — we help you measure what is happening on your own parts.
Five contact points across the vehicle where pressure distribution adds a spatial view for controlled engineering comparison.
Measuring pressure along the blade's full length can identify uneven contact under the tested arrangement. Wiping quality, noise, streaking, chatter and lift-off require separate performance evaluation.
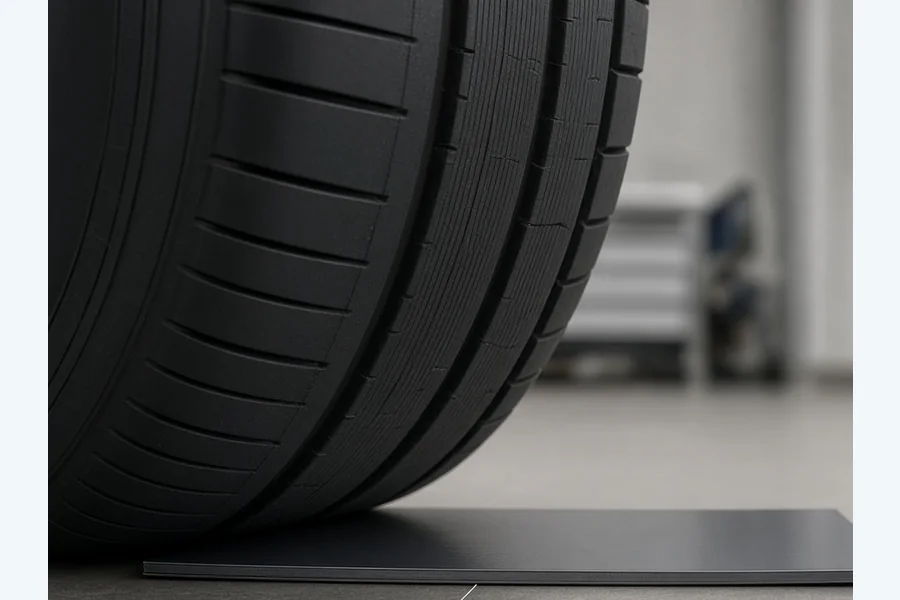
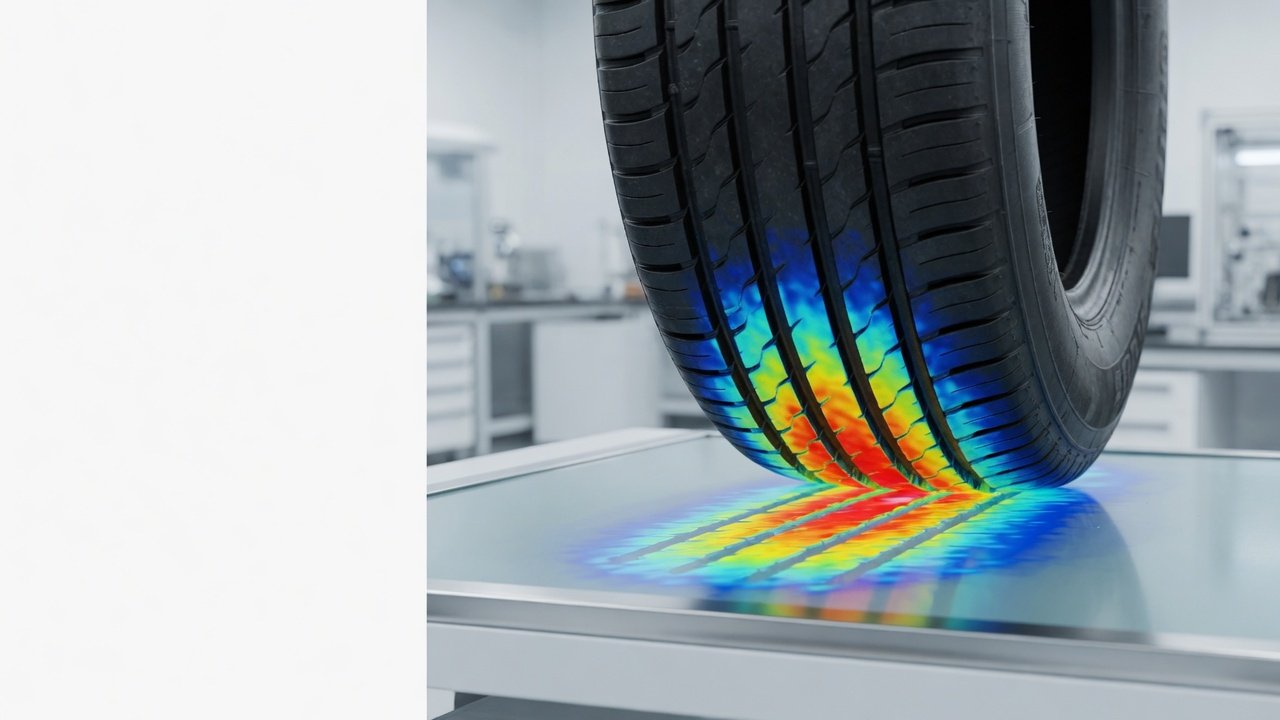
A 2D map of the static tire footprint shows how load is shared across the tread under defined conditions, supporting comparison of non-uniform contact. It does not by itself establish handling, traction, braking, wear, rolling resistance or safety.
Mapping weatherstrip pressure around the frame can identify low-contact regions that may warrant separate sealing or leakage evaluation. The pressure map is not a leak test or sealing-performance result.
Car seat pressure mapping can show distribution and local high-pressure regions under the tested seating arrangement, supporting controlled cushion and foam comparisons. It does not by itself establish occupant comfort.
Mapping contact pressure can support comparison of pad, clutch and gasket contact distribution during design or quality investigations. Performance, durability and sealing conclusions require separate evidence.
A practical workflow your engineers can run on the bench or the test rig — repeatable, documented and exportable.
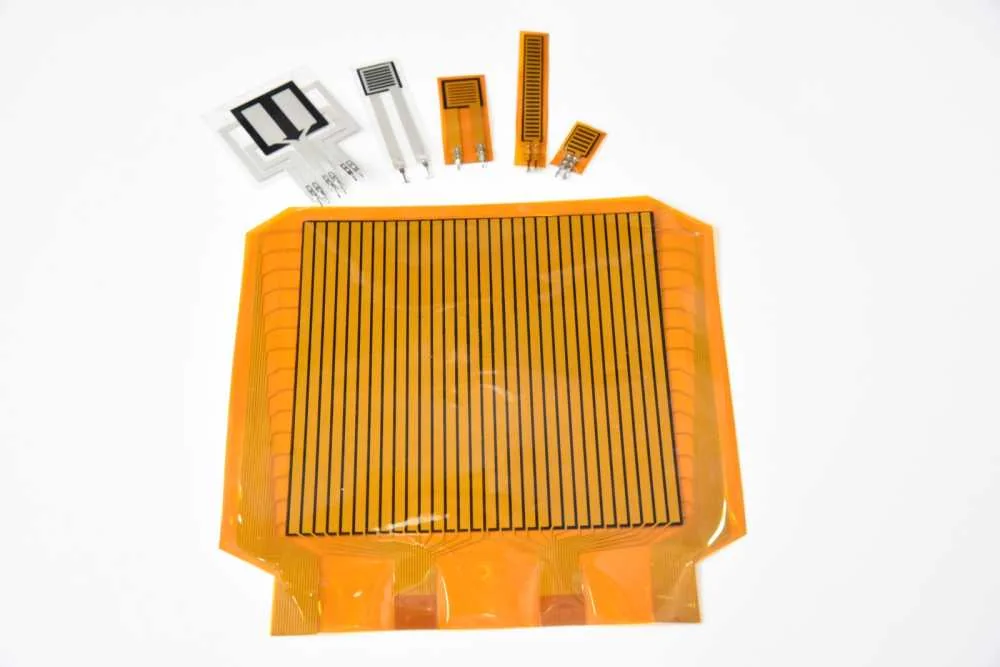
Set the ultra-thin film on the glass, tire or component surface you need to measure — it conforms to curves.
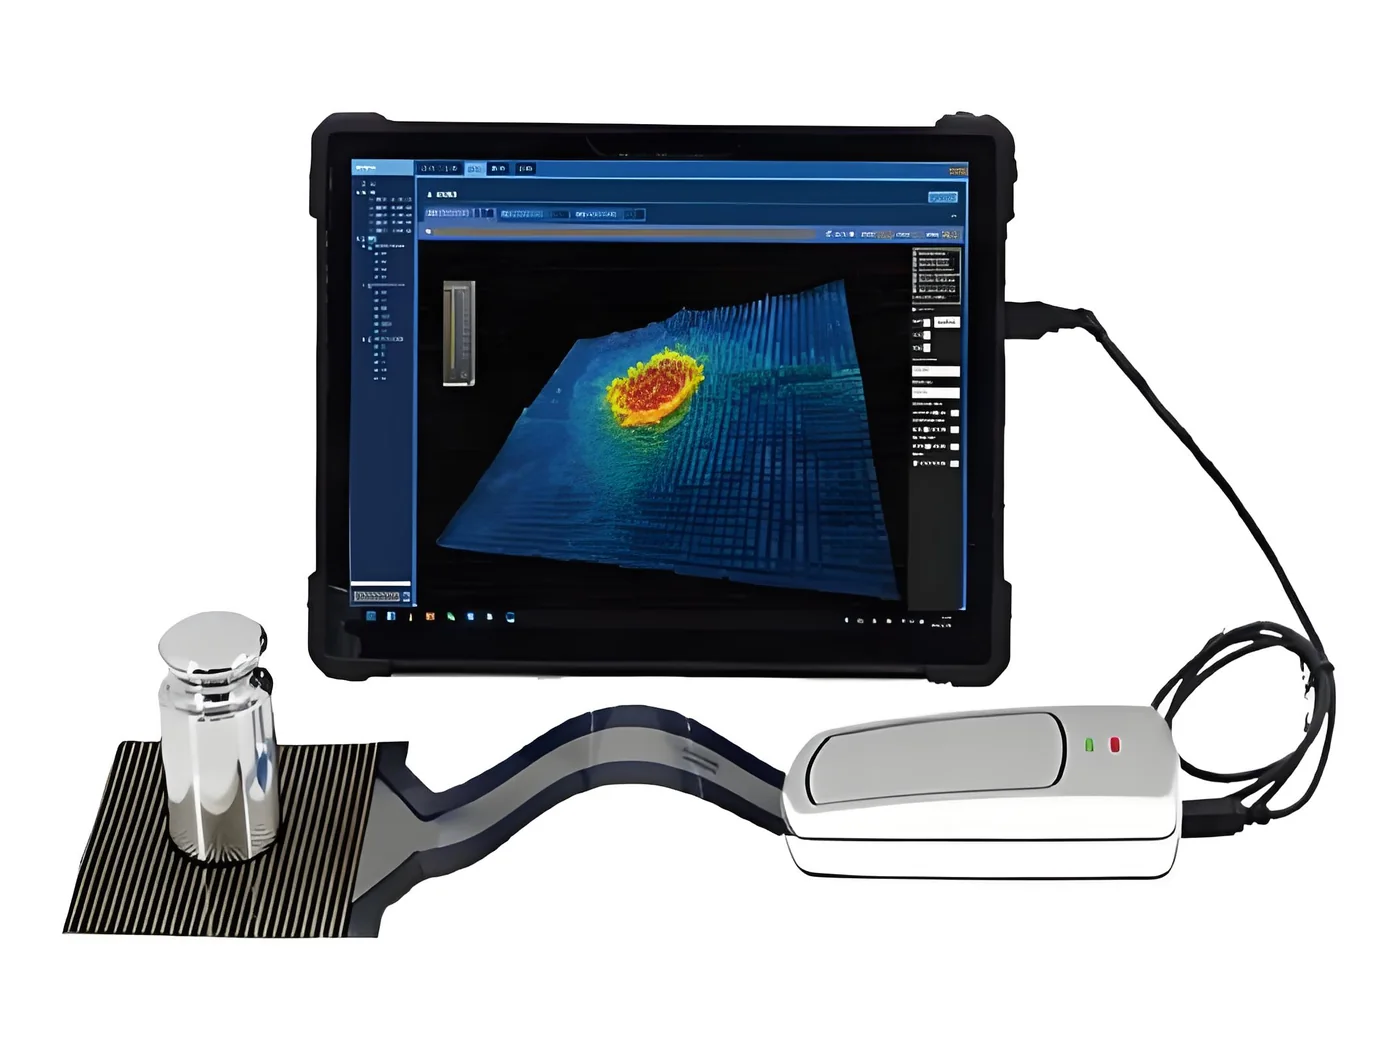
Press the wiper, lower the tire or close the seal; the system reads thousands of points in real time.
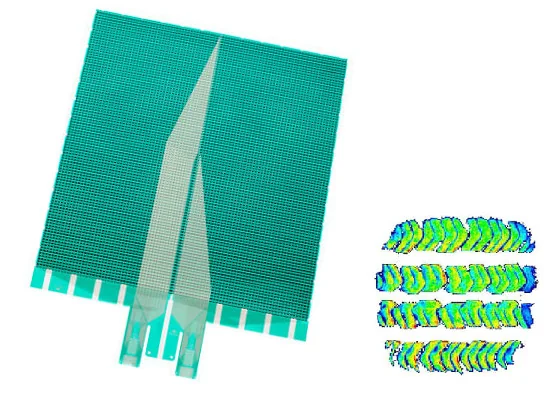
See the live pressure distribution as a colour map — uneven contact and hot spots become obvious.
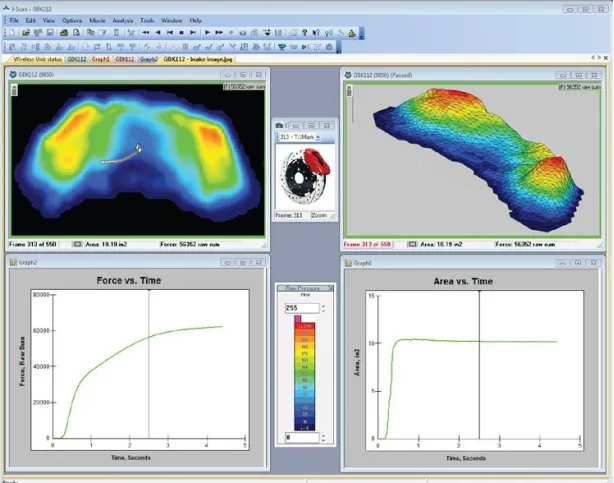
Compare documented test arrangements, generate reports and export to Excel for engineering review.
PressMapper supplies tactile film sensors thin and flexible enough to sit on curved automotive surfaces, paired with software that turns thousands of sensing points into a live pressure map.
Specifications describe the available sensor range; the right size, density and pressure rating are selected per application. Explore the full range on the Products page.
We match the right sensor and system to your component and test, and support you from selection through results.
Review sensor placement and system direction for wipers, tires, seals, seats and assembled interfaces under the stated conditions.
Reusable electronic sensor options and a practical configuration review support project-specific selection for automotive R&D and quality work.
Practical help choosing sensor size, density and range, fixturing on curved parts and reading the maps.
Share the component, contact interface, loading method and required output for a focused configuration review.
Use the published product and resource pages to prepare a focused automotive pressure-mapping inquiry.
Describe the geometry, motion, loading condition and comparison goal so the sensor and acquisition path can be reviewed together.
Sensor specifications and sample automotive measurement reports are available on request — ask for the documents that fit your component and test.
A thin tactile film sensor is placed on the glass and the wiper blade is pressed onto it. The system reads the pressure along the blade and shows it as a 2D pressure map, so you can see how evenly the blade contacts the windshield across its full length.
A pressure map can show how contact load varies along the blade under the tested arrangement, supporting comparison of blade and arm configurations. Wiping quality, noise, chatter and lift-off require separate performance evaluation.
Yes. A film sensor placed under the tire can capture pressure distribution across a static contact patch under defined load, inflation, surface and placement conditions. The map supports controlled footprint comparison but does not by itself establish handling, traction, braking, wear, rolling resistance or safety.
A low-profile flexible sensor format can be reviewed for curved interfaces such as glass or a tire contact surface. Final thickness, active area, matrix, range and routing must be confirmed for the application.
Share the component, contact surface, loading conditions and required output for application review.
Review application evaluationPrefer email? Reach us at info@pressmapper.com