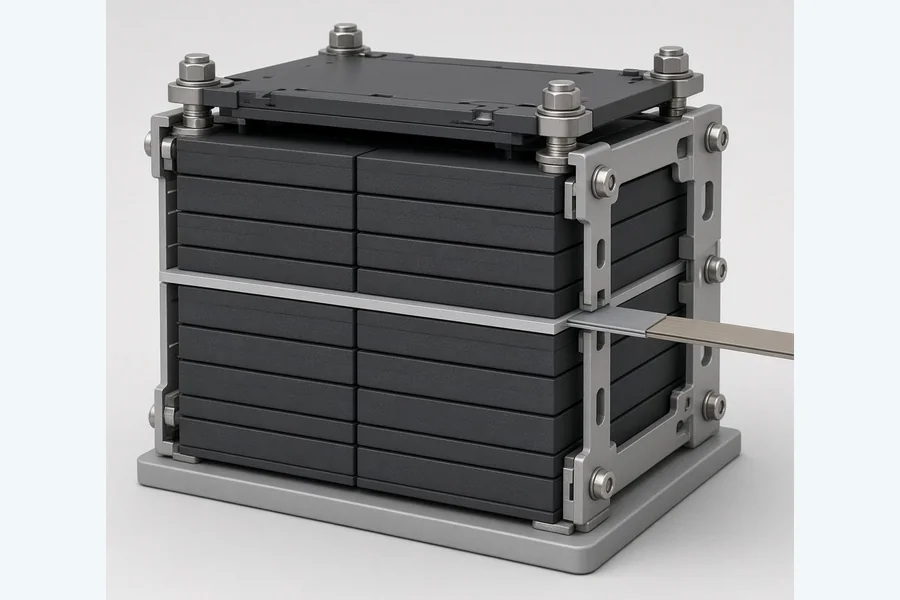
Cell stacking pressure
During stacking or winding, a pressure map can show layer-to-layer distribution differences for comparison under documented conditions. It does not by itself establish capacity or cell performance.
See how contact pressure is distributed across battery cells and modules — from cell stacking and pouch flatness to module assembly and charge/discharge swelling — with reusable film sensors and real-time 2D & 3D maps.
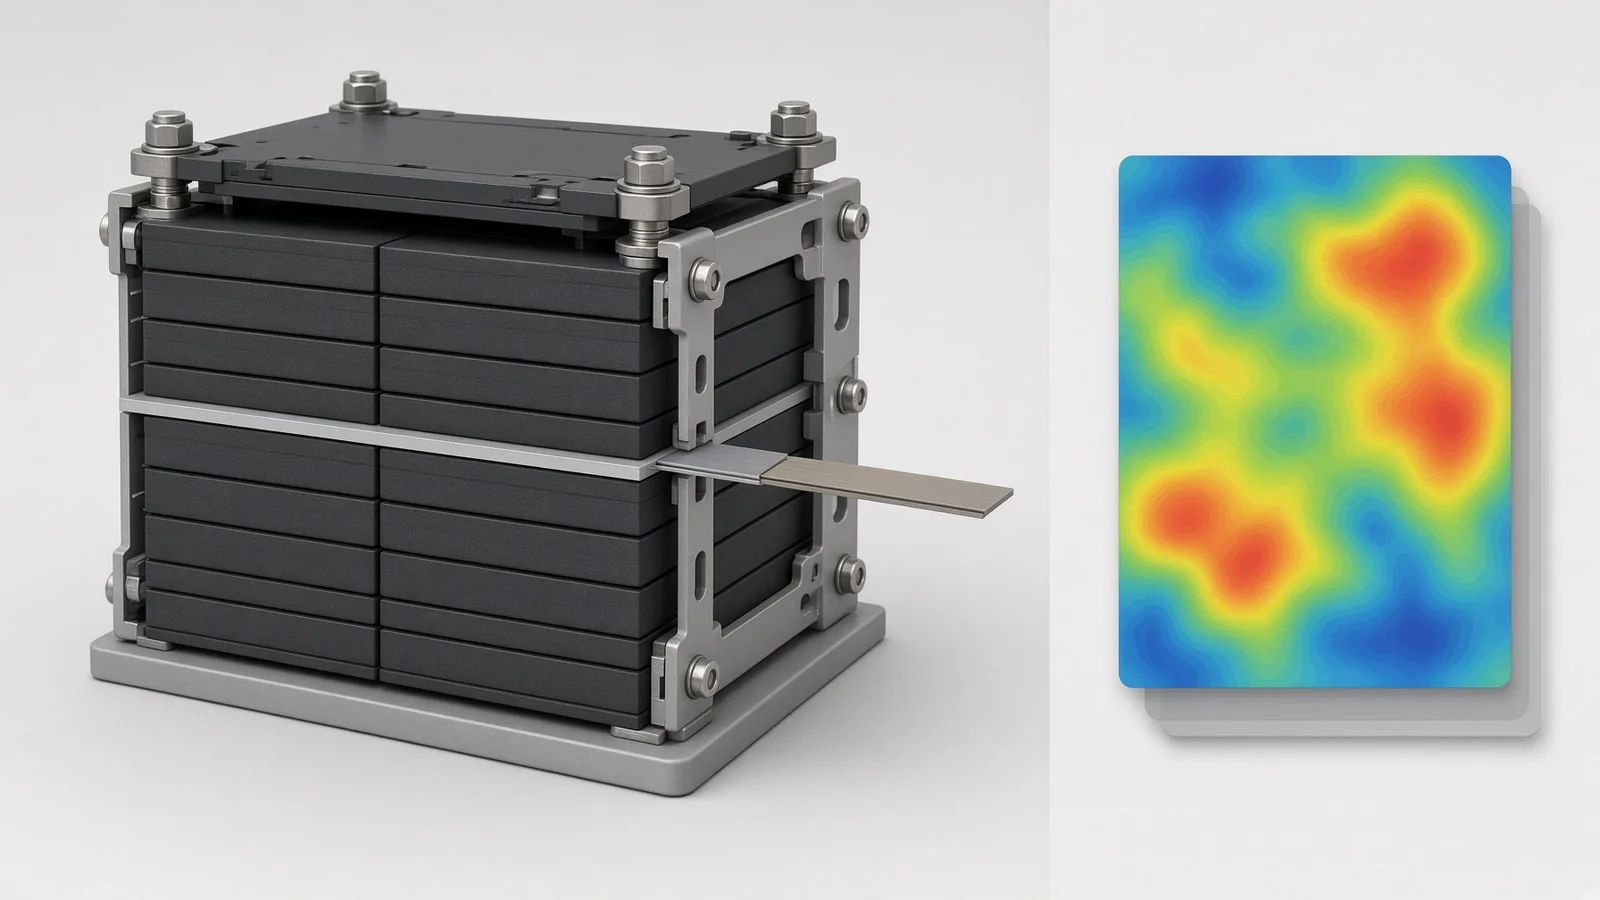
Battery pressure mapping shows how contact load is distributed across a defined cell, module or stack interface. A suitable setup can help teams compare compression patterns, locate high and low contact regions, and review changes between controlled assembly or test conditions. Sensor area, range, loading sequence, duration, temperature and required output must be defined before configuration.
Published battery research examines relationships between stack pressure and cell behaviour. Pressure mapping makes the mechanical load distribution visible for the tested interface and conditions.
The research context above is not a claimed battery outcome. Pressure mapping characterizes mechanical load distribution under the tested arrangement and does not by itself establish electrochemical performance, safety or lifetime.
Five common measurement points across cell and pack manufacturing — each one a place where seeing the pressure distribution can reveal problems early.
During stacking or winding, a pressure map can show layer-to-layer distribution differences for comparison under documented conditions. It does not by itself establish capacity or cell performance.
Pouch cells need a flat, even contact surface. A 2D pressure map shows raised or low areas at a glance, so flatness issues can be caught before lamination or assembly.
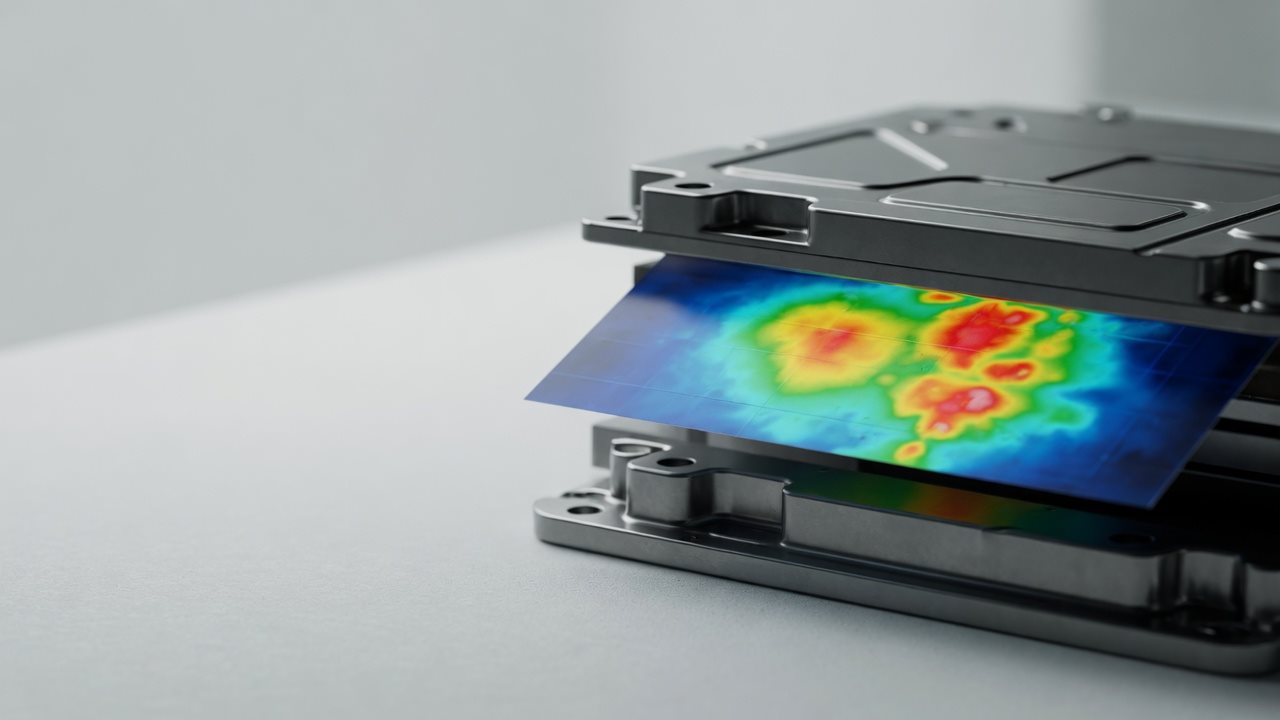
When cells are clamped into a module, the holding pressure should be uniform across every cell interface. Mapping it can help verify even clamping and spot pinch points.
As a cell cycles it can expand and contract. A configured measurement can track how contact load changes during the defined charge/discharge condition, supporting documented comparison of the tested arrangement.
At stack or pack level, a full-area map shows how load is shared across the tested interface and supports controlled comparison of distribution patterns. It does not by itself establish performance or longevity.
Follow the measurement path from a defined battery stack or module interface to a pressure distribution result under controlled loading.
Placement. Pressure mapping can visualize how compression is distributed across the tested battery stack or module interface.
Test conditions. Sensor placement, fixture design, loading method and test conditions affect the result.
Result boundary. The visualization applies only to the tested arrangement and does not by itself establish safety, life or production performance.
PressMapper supplies tactile film sensors thin enough to place between cells or module layers, paired with software that turns thousands of sensing points into a live pressure map.
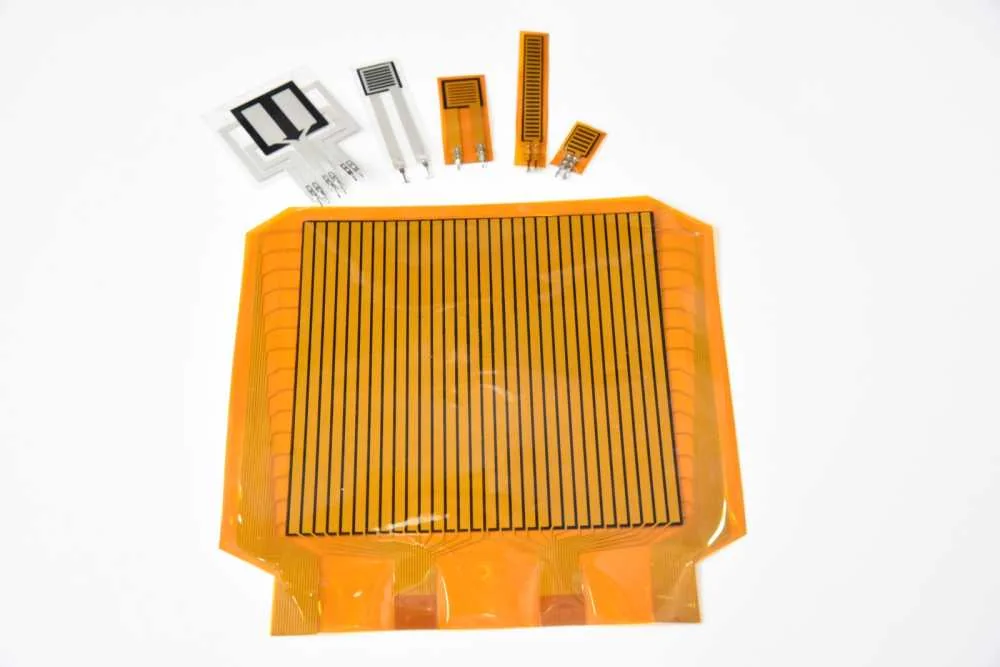
Specifications describe the available sensor range; the right size, density and pressure rating are selected per application. Explore the full range on the Products page.
We match the right sensor and system to your cell format and assembly step — and support you from selection through results.
Review sensor placement and system direction for cell stacking, flatness, assembly and swelling measurements under the stated conditions.
Reusable electronic sensor options and a practical configuration review support project-specific selection for battery development and quality work.
Practical help selecting sensor size, density and pressure rating, setting up tests and reading the maps.
Share the cell, module or stack interface, loading method and required output for a focused configuration review.
Describe the geometry, loading sequence, accessible area and comparison goal so the sensor and acquisition path can be reviewed together.
Sensor specifications and sample battery measurement reports are available on request — ask for the documents that fit your cell format and assembly step.
Use the published product and resource pages to prepare a focused battery pressure-mapping inquiry.
Explore sensor placement, fixture influence, loading modes and result boundaries for a defined stack or module interface.
Collect the interface, loading and output information needed for configuration review.
Lithium-ion cells can change volume as they charge and discharge, so contact load distribution is one mechanical condition that teams may need to observe at a defined cell or module interface. Pressure mapping can show high and low contact regions under the tested arrangement, but it does not by itself establish electrochemical performance, safety or lifetime.
It depends on the cell format and assembly step — from light contact pressure on pouch cells to higher clamping loads in modules. PressMapper offers a range of sensor pressure ratings and sizes; share your application and we will recommend a suitable sensor rather than assume a fixed value.
Yes. These are electronic tactile film sensors designed for repeated measurements, unlike one-time chemical pressure-indicating film, so you can run comparative tests, document results and export the data.
A low-profile thin-film sensor format can be reviewed for placement between cells or module layers. Final sensor thickness, active area, matrix and routing must be confirmed for the application.
Share the cell, module or pack interface, loading conditions and required output for application review.
Review application evaluationPrefer email? Reach us at info@pressmapper.com